Reflection Electron Energy Loss Spectroscopy (REELS)
Performed with the AUGER PROBE
The Auger Probe Spectrometer
The Auger Probe (AP) is a high performance compact energy analyzer designed for operation in complex vacuum systems. It has a large working distance (50mm), is resistant to material deposition and can operate at higher vacuum pressures. The AP is used in deposition systems like MBE and PLD, where it can run during the process to provide in situ and real time analysis. The AP is also used in vacuum transfer lines and preparation chambers to check for surface cleanliness and to follow in operando cleaning processes such as thermal desorption. Because of its small size and long working distance, the AP provides AES and REELS in analysis chambers with limited access space to the sample. The long working distance keeps a clearance to the sample large enough not to occult particle fluxes from the material sources.
The AP has a continuous and computer controlled energy resolution. It can operate at high resolution for REELS or high sensitivity for AES by simply electronically adjusting the resolution, without moving any mechanical part (like slits or apertures). In addition, optional differential pumping allows the AP to operate at higher vacuum pressures, to several 10 millitorr.
Capabilities of REELS as an analysis method
The REELS method offers the following characteristics:
– The energy loss distribution reflects the chemical environment related to the electronic density of the state (DOS) of the valence and conduction bands.
– The primary beam energy can be adjusted in a wide range, from less than 100eV up to 2,000eV, when using the Auger Probe (AP). Therefor the depth of information can be easily changed.
– All incidence angles are possible, especially grazing angles for highest surface sensitivity.
– Most insulators can be analyzed because REELS is not very sensitive to sample charging.
REELS offers following advantages over transmission Electron Energy Loss Spectroscopy (EELS).
– A low energy primary beam can be used.
– All elements and compounds can be analyzed as a solid or a layer deposited on a surface.
– No delicate and costly sample preparation (thinning).
– Simple and flexible experimental setup that can be adapted to most vacuum chambers.
– Shorter acquisition time to follow dynamic processes.
– Non-destructive analysis of adsorbed molecules is possible using low beam currents and larger beam spot diameter.
– Easily integrated in complex deposition systems, like MBE, PLD, ALD, and with RHEED.
– Can operate in vacuum pressures up into several 10 mtorr range to dynamically monitor in operando the surface composition.
Experimental Setups
The different REELS capabilities of the AP especially for in operando analysis, described in this paper, are performed using the following experimental setups (Figure 1).
Setup A is a classical arrangement for combined AES – REELS analyses using a scattering angle of 90 degrees (angle between primary electron beam and analyzer axis). The sample can be tilted to vary the electron beam incidence to the surface and thus change the surface sensitivity. The electron gun operates in the energy range from less than 100eV to 5,000eV.
Setup B is the same arrangement but with a RHEED capability. The electron gun operates up to higher energy, 20 keV and more. It can also operate at low energies to below 500 eV.
A more versatile arrangement is Setup C with two electron guns, one for low energy at 45 degrees incidence angle and one high energy at grazing incidence.
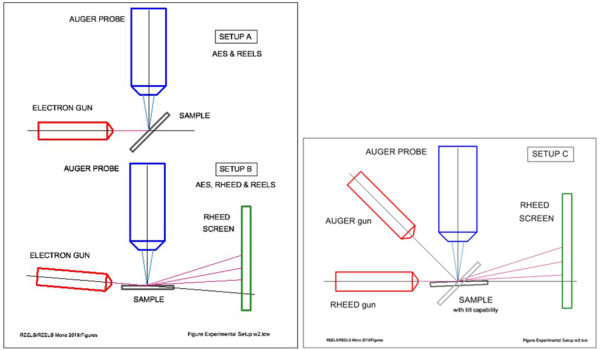
Figure 1: Three experimental set-ups for the Auger Probe (AP) and an electron source for excitation.
In Operando measurement of the deoxidation of GaSb a surface
The AP is mounted on an MBE deposition chamber and uses the RHEED electron gun for excitation (Figure 1, Setup B). A microcontroller unit (GCU) is used to accurately alternate the gun operation in high energy for RHEED to low energy for REELS. The acquisition speed is 5eV/s. Single energy scans are continuously acquired while increasing the sample temperature.
Figure 2 below shows that the REELS spectra are stable until the decomposition temperature is reached. Then the energy loss distribution changes drastically and remains stable with further increases of the temperature.
Most remarkable is the step like increase of the elastic peak intensity which is a function on the average atomic number Z of the alloy on the surface. The rise reflects the increase of the average Z of the surface layers from oxidized to bare GaSb.
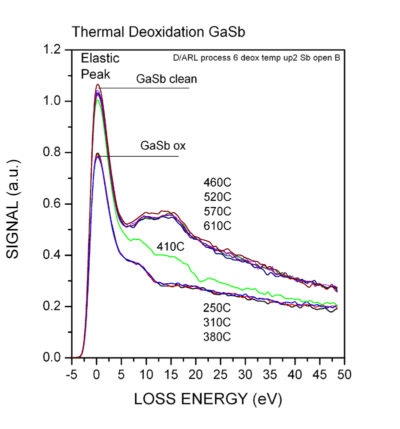
Figure 2: REELS spectra of GaSb during process as temperature changes.
Comparison between REELS and EELS energy distributions
A large amount of EELS data are available, with many of these posted on websites. This provides a comparison with REELS data that is useful for identification of the loss structures. EELS data predominantly reflects bulk energy losses because the sample is a very thin layer crossed by the primary electron beam of high energy. The thickness of thesample is adjusted to reduce electron scattering and optimize excitations of energy losses. In contrast, all REELS electrons are strongly back scattered and issued from various depths from the surface. The lower beam energy enhances the near surface excitations.
Figure 3 shows a comparison for STO. Using the AP, REELS measured at different temperatures (upper curves) are displayed, with an EELS distribution included for comparison. Tabulated energy levels are also indicated.
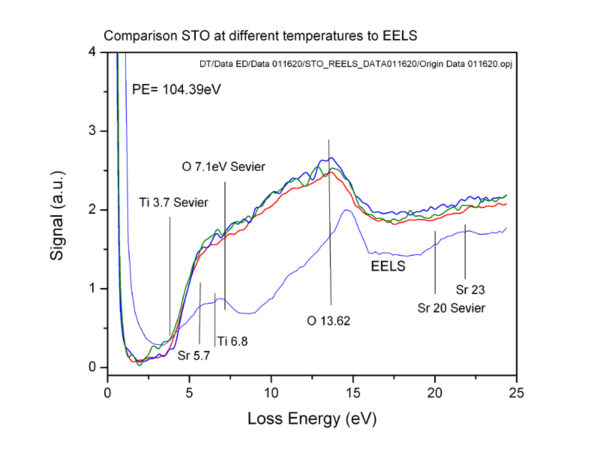
Figure 3: REELS spectra compared with EELS distribution.
In operando analysis of GaAs heating
An epi-ready GaAs (111) sample is progressively heated and REELS acquisition run throughout.
After a rapid initial cleaning phase, the distribution remains quite stable once reaching 300C to 500C (Figure 4). Then the distribution changes at about 500C and remains stable at higher temperatures. This is interpreted as de-oxidation and Ga enrichment of the surface.
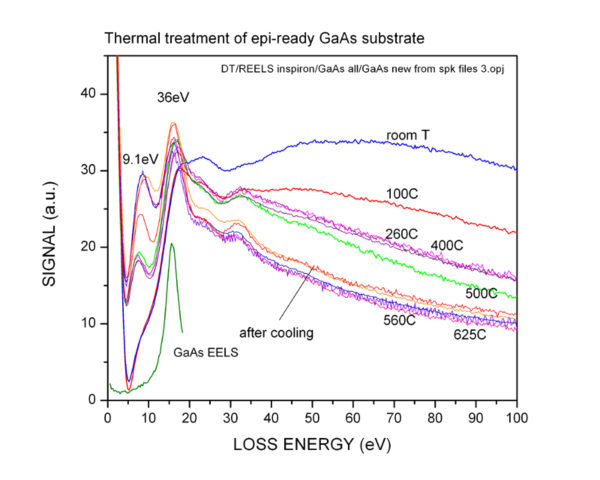
Figure 4: REELS spectra.
In operando Ar ion cleaning
Argon ion cleaning can be monitored in real time by REELS and AES. Ion sputtering can be monitored during bombardment. The AP analyzer can work at higher vacuum pressures, so pressure in the chamber can reach 1.E-4 Torr without differential pumping.
Figure 5 shows the modification of the REELS distribution from a carbon contaminated initial surface to a clean STO substrate. The Argon pressure in the chamber is 5.10-5 Torr.
The AP is able to work at higher vacuum pressures, like in PLD environment. The differential pumping option allows operation up to several 10 mTorr.
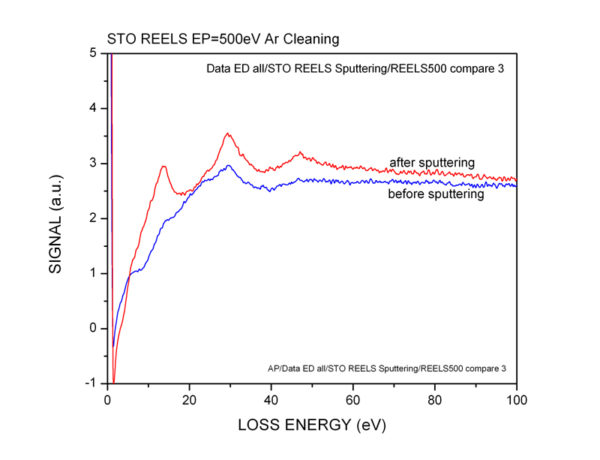
Figure 5: REELS spectra before and after ion sputtering.
The corresponding Auger spectra measured with the AP in AES mode and with higher primary beam energy (5keV) confirms the removal of the carbon contamination (Figure 6).
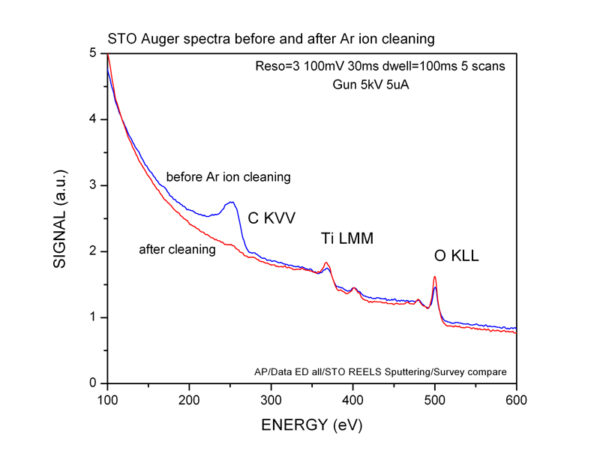
Figure 6: Auger spectra before and after ion sputtering.
Primary Beam Energy as a tool for damage free in-depth analysis
A major advantage of REELS is the wide range of primary energies that can be used. AES and XPS use the variation of the incidence and take-off angles to perform in depth analysis. However, the effect is limited by the small escape depth of the emitted electrons, especially the Auger electrons. The same behavior is observed with REELS with the specific advantage that backscattered electrons are penetrating deeper under the surface. The penetration depth is a function of the kinetic energy that can be easily adjusted over the operating range of the electron gun. In addition, the cross sections for excitations also depend upon the primary energy, with lower energy enhancing the low energy excitations. Figure 7 compares REELS distributions taken under the same geometric arrangement (no angle modification) and simply lowering the gun energy. Note the gain of information in the valence band region at lower energy.
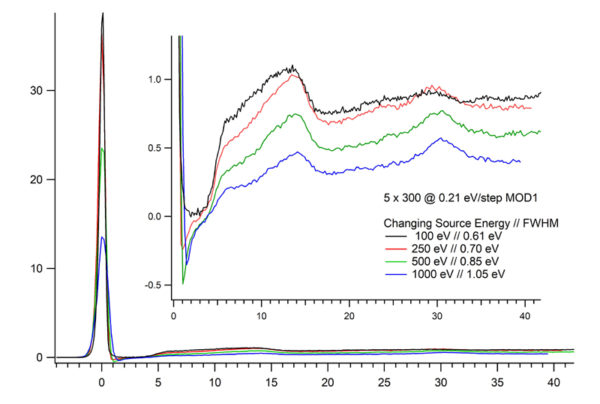
Figure 7: REELS spectra at different gun energies.
Valence and Band Gap measurements
The Gaussian shape of the elastic peak provides a signal free of “wings” at the peak’s base (no Lorenzian contribution). This allows the measurement of low energy losses in the valence or conduction band of the material. The energy resolution is best when the primary beam energy is lowered to the range of 500eV or less. A FWHM of the elastic peak of 0.5eV is reached assuming proper alignment of the AP and normal environmental conditions (no stray DC and AC magnetic fields).
In Figure 8, the distribution shown corresponds to band transitions and reflects the density of occupied and empty states of the valence and conduction band. The onset of the band transitions appear as inflection points in the distribution. The threshold energy is determined as the intersection point of extrapolated lines, as shown in the figure for a STO sample after Ar ion sputter cleaning.
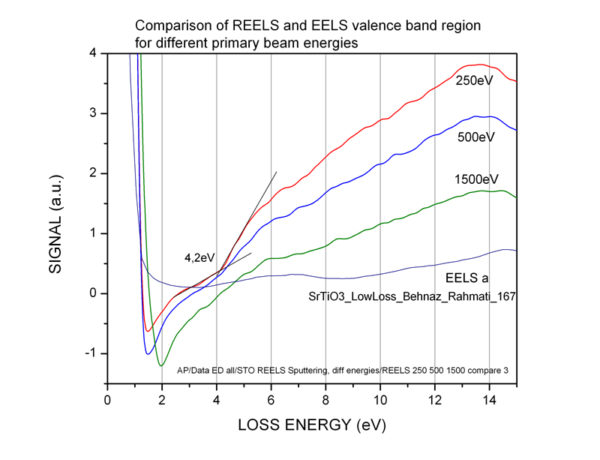
Figure 8: REELS spectra.
Working at different primary beam energies
The primary beam can be easily adjusted over a wide range of energies. RHEED guns are able to work at 500eV or less, Auger guns at 100eV or less. The Gun Computer Control (GCU) option uses a microcontroller to set and save all beam parameters allowing easy, reproducible operation. Figure 9 shows the modification of REELS distributions at different primary electron energies.
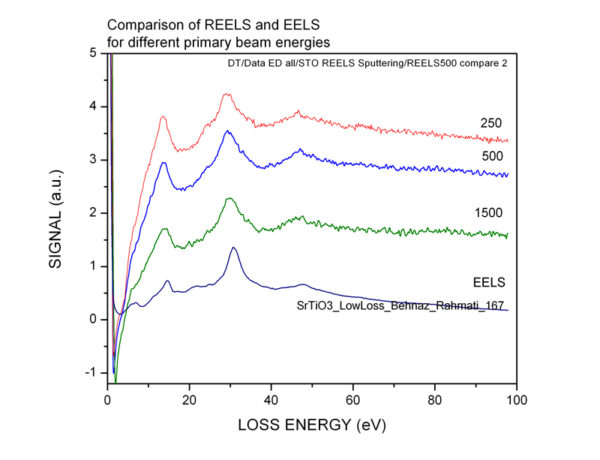
Figure 9: REELS spectra at varied primary beam energies with comparable EELS spectrum.
Working at different incidence angles
The surface sensitivity increase observed when setting the primary beam at a grazing angle is a well known effect used in AES and XPS analysis. A similar increase of the surface contribution with the electron beam at low angle is found in REELS, as shown in Figure 10. Surface excitations become more pronounced and thus can be identified. Combining low beam energy and grazing angle gives REELS a unique capability to analyze fractions of a monolayer deposited, and potentially to measure their band gap.
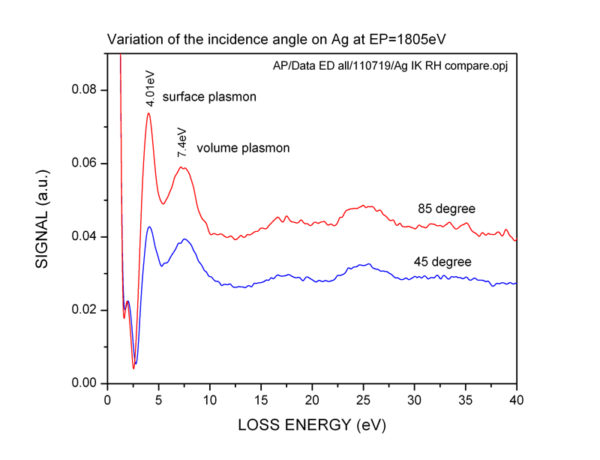
Figure 10: REELS spectra at varied primary beam incidence angles.
The examples presented in here are measured using following instruments:
Operando Auger Probe Spectrometry System
| Item | Product # | Description |
|---|---|---|
| Energy analyzer | AP-38 AP-64 |
Auger Probe for AES and REELS mounted onCF2.75OD or CF4.5OD flange |
| RHEED electron gun | EK-15-R EK-20-R EK-30-R EK-35-R EK-50-R |
electron gun for RHEED, AES and REELS operating in the range 500eV up to 15, 20, 30, 35 or 50 kV |
| Auger electron gun | EK-5-S | electron gun for AES and REELS operating in the range 50eV to 5,000eV |
Operando High Vacuum Pressure options
| Item | Product # | Description |
|---|---|---|
| RHEED Electron gun | RH-DP RH -DDP |
Single or double differential pumping options for operating pressures up to 1 torr |
| Energy Analyzer | AP-DP | Single or double differential pumping options of for operating pressure up to 100 mtorr |
Computer Controls and Data Acquisition
| Item | Product # | Description |
|---|---|---|
| Gun Computer control | GCU | Microcontroller for intelligent control of all electron gun operating parameters and for saving multiple settings |
| Beam Current Controller | BCC | Microcontroller with PID integrated to regulate the primary beam current with feedback to acquisition interface for data normalization |
| Computer control and Data Acquisition | AP-LV | LabView software package to control the AP, the electron gun and acquire data |
| Sample current meter | SCM | Precise measurement the sample current with feedback to acquisition interface for data normalization (optional) |
Other Options
| Item | Product # | Description |
|---|---|---|
| Magnetic shielding | custom design | Shielding of the electron beam in environments with stray magnetic interference fields ( AC and DC) |
| UHV vacuum chamber | SYS-UHV | standard or custom designed for single or multiple analysis with transfer and load lock systems |
More about the Energy Resolution of the Auger Probe
REELS requires an energy resolution that is not provided by the a single pass Cylindrical Mirror Analyzer (CMA), the most commonly used analyzer for AES in the recent years. Figures 11 show the strong difference between a large size CMA and an AP. Both distributions are taken on clean Ag at a primary beam energy around 2,000eV. This comparison justifies the lack of interest for REELS studies using conventional CMAs.
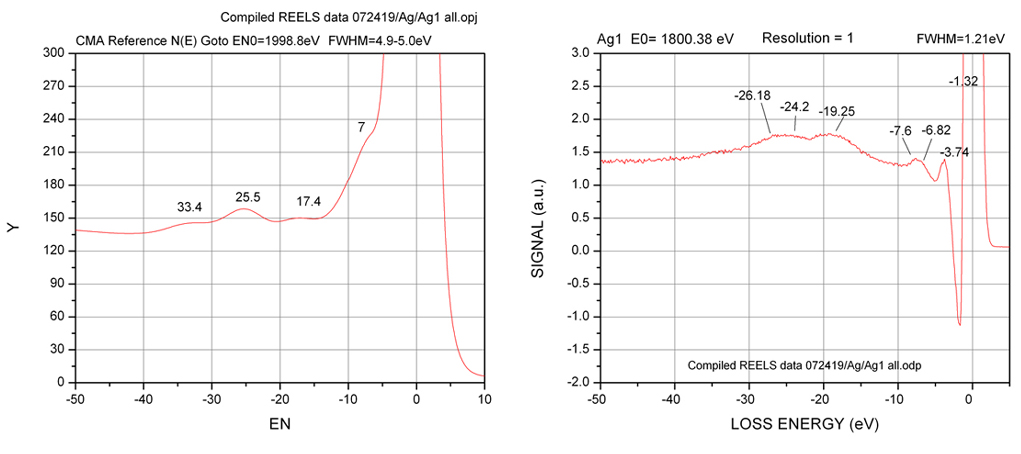
Figure 11: Characteristic Energy Loss distributions of Ag measured by a CMA (left) and by the Auger Probe (right)
The energy resolution obtained in REELS depends on two major factors, the energy resolution of the analyzer and the energy spread of the primary electron beam. The result is the convolution of both contributions and the result is
Δ Etotal = √ ( Δ E2beam + Δ E2analyzer )
assuming Gaussian shapes for the both distributions.
For this calculation, the energy spread of the electron guns is given by the thermal energy spread of the electrons emitted from the hot cathode and of the voltage stability and ripple of the high voltage supply. The measured energy spread of the electron beam ranges ranges from 0.35 and 0.5eV depending on the filament heating.
The analyzer resolution depends on the beam energy, with lower energies giving better resolution. The energy spread of the electron gun is basically independent of the energy. Figure 12 shows the energy resolution FWHM of less 0.5 eV reached on the elastic peak at low kinetic energy.
A striking feature of the AP analyzer is that the elastic peak follows a Gaussian distribution even at the base of the peak, where most other analyzers show Lorenzian wings on both sides of the peak (Figure 13). The log plot of the peak still follows a Gaussian line shape at 1/100 of the peak maximum. This feature is a major advantage for measuring energy losses in the valence band region just a few eV from the elastic peak maximum.
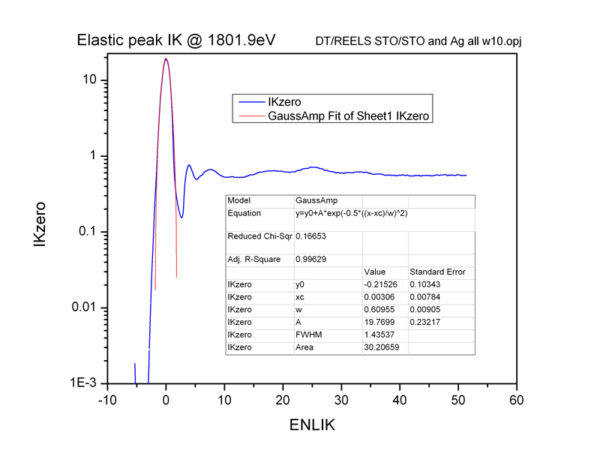
Figure 12: The elastic peak of the AP analyzer follows a Gaussian distribution.
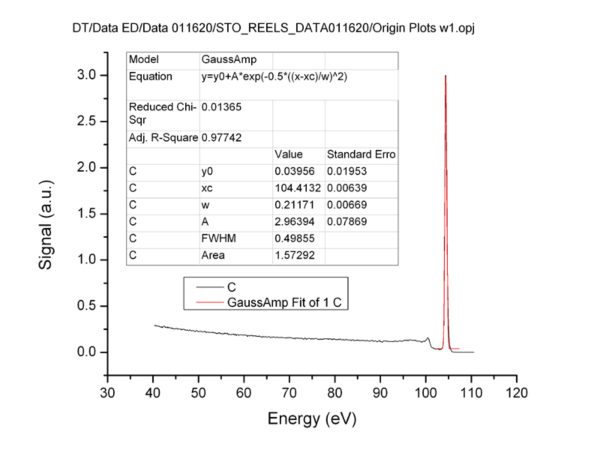
Figure 13: Elastic peak measured at low energy with a FWHM of less 0.5 eV.
References
All data presented above reflect recent developments and are unpublished.
Auger Probe Publications
P. Staib, J. Vac. Sci. Technol. B 29, 3 (2011).
W. L. Calley, J. Greelee, W. E. Henderson, J. Lowder, M. W. Mosley, W. A. Doolittle, P. Staib, J. Vac. Sci. Technol. B 31, 3 (2013).
T. Orvis, M. Surendran, Y. Liu, A. Cunniff, J. Ravichandran, J. Vac. Sci. Technol. A 37(6), Nov/Dec 2019.
P. Staib, Spectroscopy for real-time in situ surface monitoring, Chapter 7, In-Situ characterization of thin film growth, Edited by G. Koster and G. Rijnders (Woodhead Publishing in Materials, 2011).
